

wandb.plot let you track charts with wandb.Run.log(), including charts that change over time during training. To learn more about the custom charting framework, see the custom charts walkthrough.
Basic charts
To create a W&B chart:- Create a
wandb.Tableobject and add the data you want to visualize. - Generate a plot using one of the W&B’s built-in helper functions
- Log the plot with
wandb.Run.log().
- Line
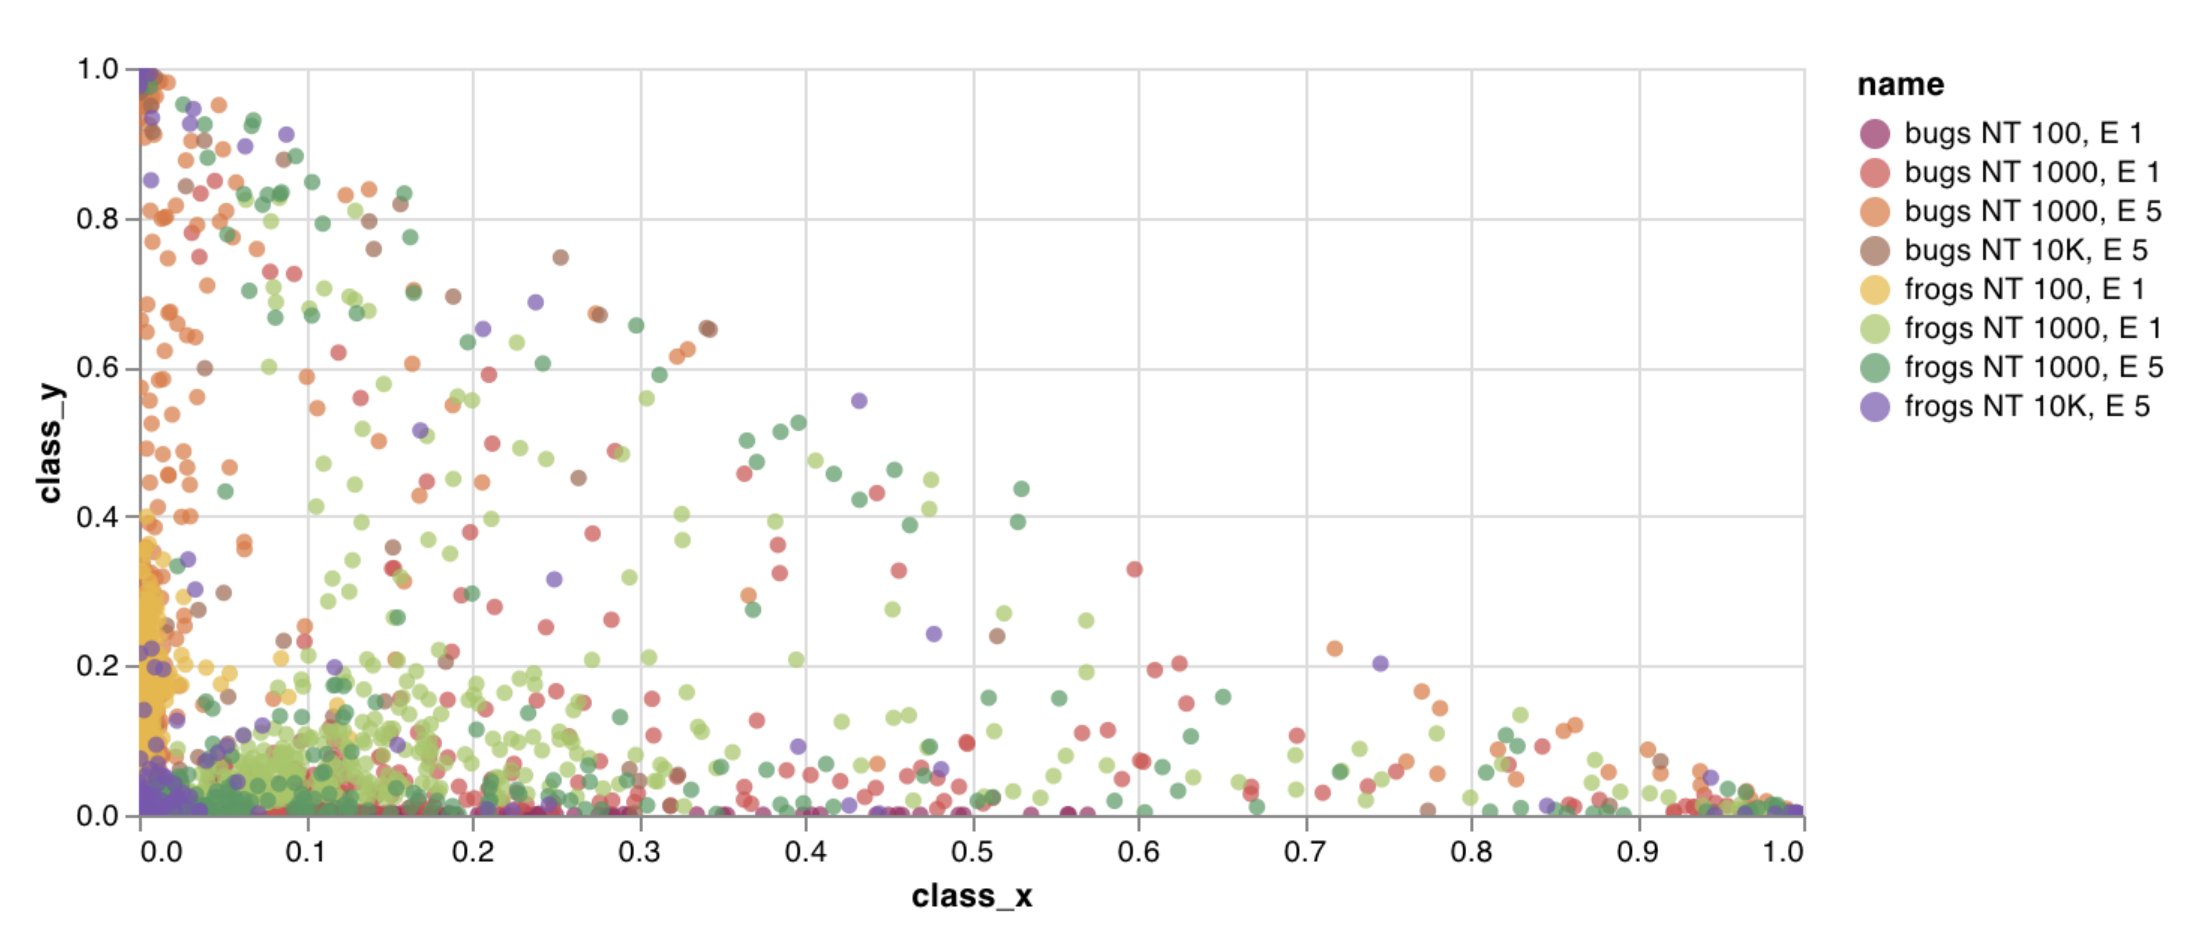
- Scatter
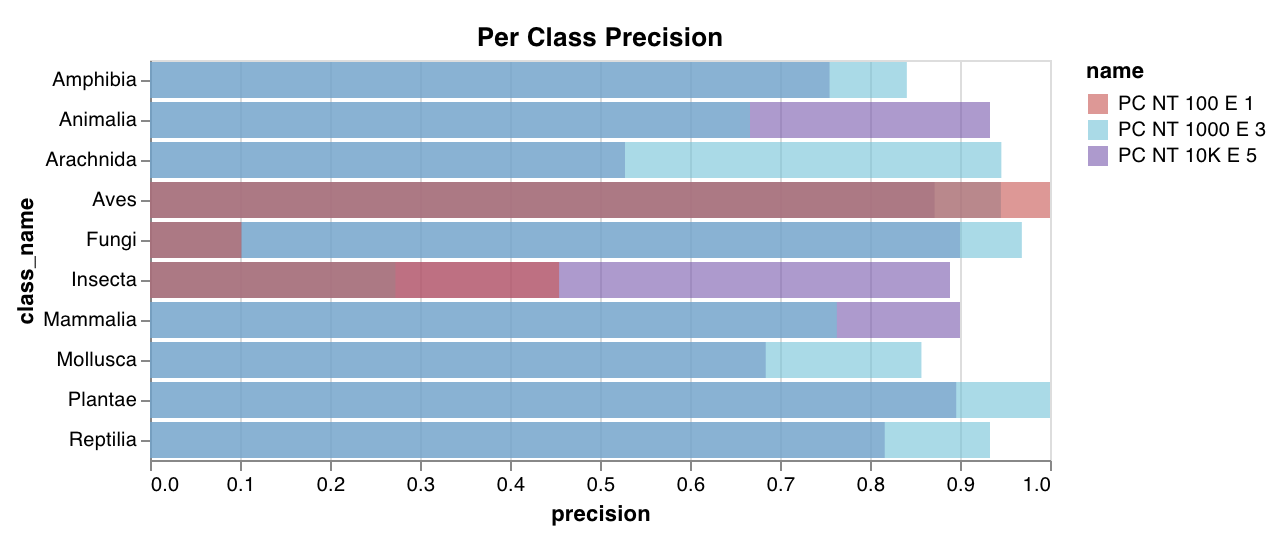
- Bar
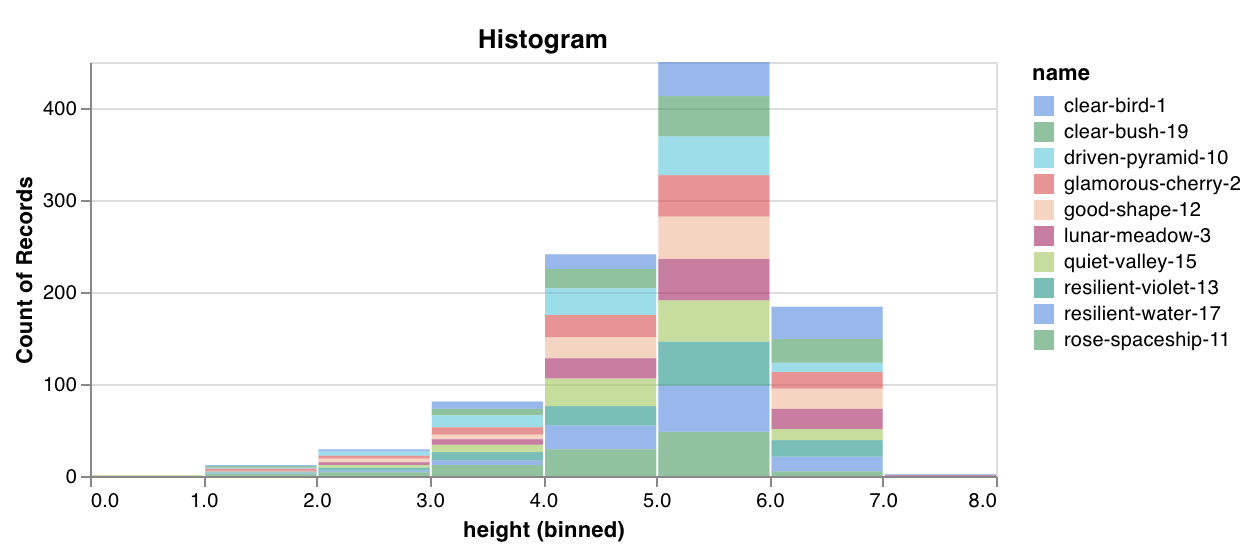
- Histogram
- Multi-line
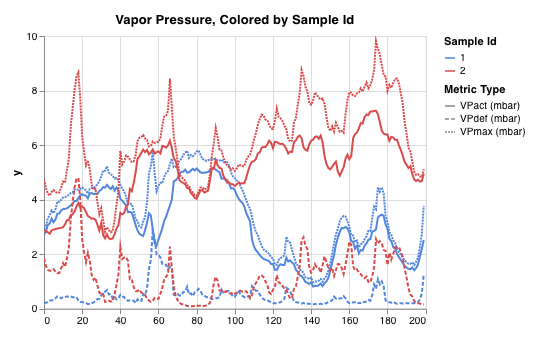
Log a custom line plot, a list of connected and ordered points on arbitrary axes.You can use this to log curves on any two dimensions. If you’re plotting two lists of values against each other, the number of values in the lists must match exactly. For example, each point must have an x and a y.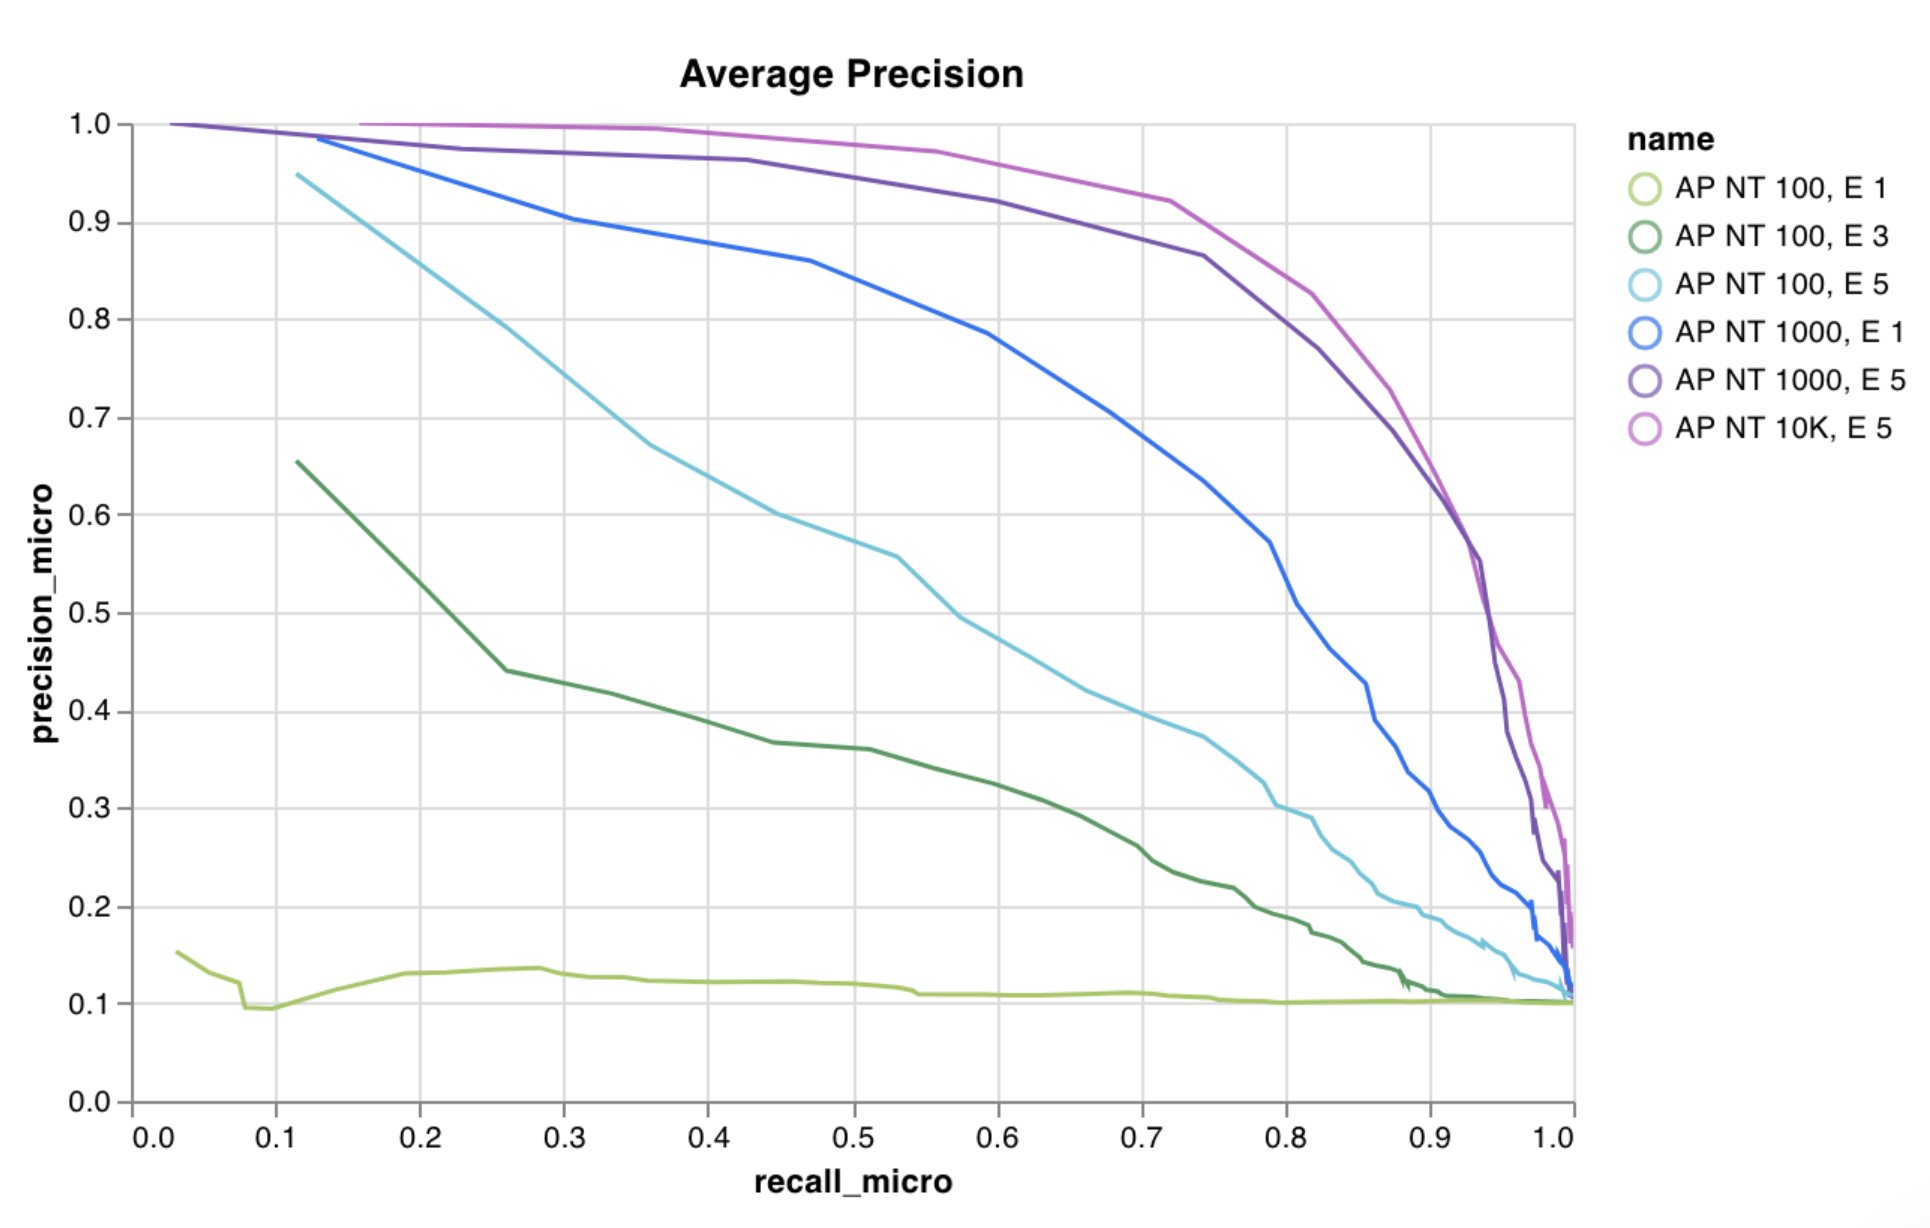
Model evaluation charts
These preset charts have built-inwandb.plot() methods that make it quick to log charts directly from your script and see the exact information you’re looking for in the UI.
- Precision-recall curves
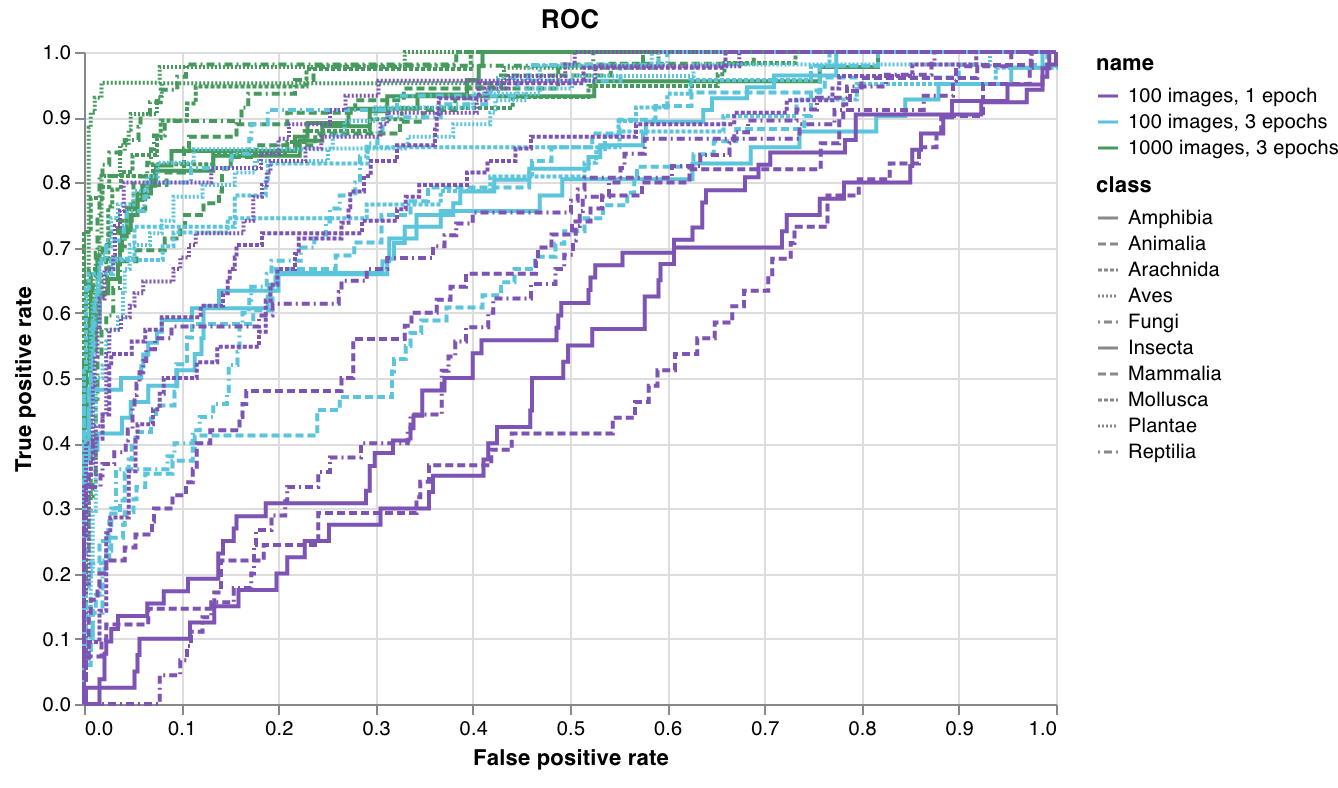
- ROC curves
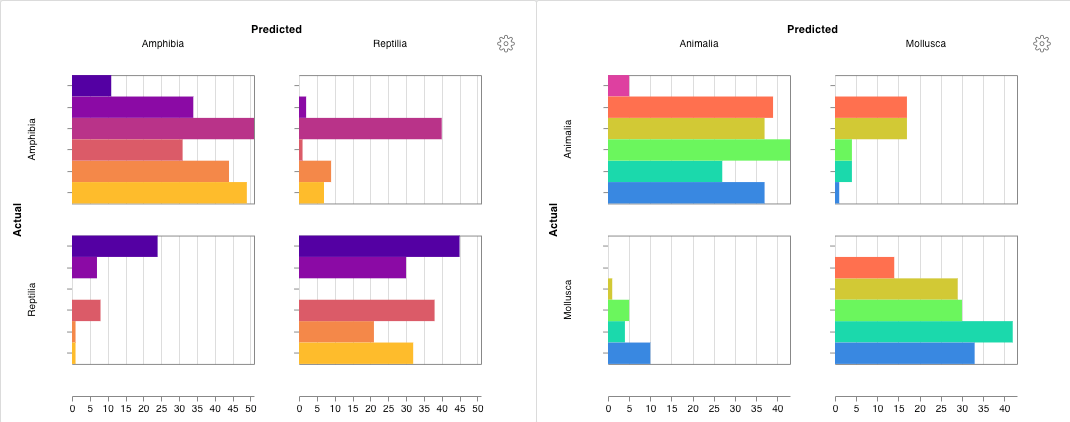
- Confusion matrix
Create a Precision-Recall curve in one line:You can log this whenever your code has access to: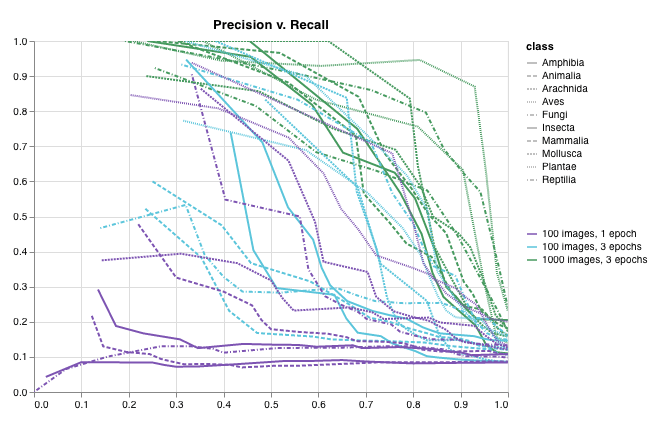
- A model’s predicted scores (
predictions) on a set of examples. - The corresponding ground truth labels (
ground_truth) for those examples. - (Optional) A list of the labels or class names. For example,
labels=["cat", "dog", "bird"], if label index 0 means cat, 1 means dog, 2 means bird. - (Optional) A subset (still in list format) of the labels to visualize in the plot.
Interactive custom charts
For full customization, tweak a built-in Custom Chart preset or create a new preset, then save the chart. Use the chart ID to log data to that custom preset directly from your script.Matplotlib and Plotly plots
Instead of using W&B Custom Charts withwandb.plot(), you can log charts generated with matplotlib and Plotly.
matplotlib plot or figure object to wandb.Run.log(). By default we’ll convert the plot into a Plotly plot. If you’d rather log the plot as an image, you can pass the plot into wandb.Image. We also accept Plotly charts directly.
If you get an error like “You attempted to log an empty plot”, store the figure separately from the plot with
fig = plt.figure() and then log fig in your call to wandb.Run.log().